IR teams play a pivotal role in communicating a company’s strategy and value to investors. This effort is most impactful when investors can see a tangible linkage between strategic direction, financial results, and guidance. Understanding the determinants of share price returns can help IR teams communicate their forward-looking strategies to investors, as well as help unpack investor expectations built into companies’ own share prices.
Research published earlier this year by Fortuna Advisors looks at how companies produced exceptional market returns over the last five years by examining how different metrics influenced Total Shareholder Returns (TSR). So what does it take be a top-quartile value creator? As seasoned professionals know, this will vary by industry, sector, the period under consideration, and a host of other factors. But, at first glance two metrics stood out in our analyses: Revenue Growth and Reinvestment Effectiveness—a measure we developed to quantify how well companies convert reinvestment into revenue. In this sense, it serves as a general barometer of how well managements invest their capital and understand where value creation opportunities exist. However, these measures don’t always tell the whole story.
As we explain in more detail below, focusing on one or several incomplete metrics can lead to adverse decision-making and financial outcomes. This is why we believe companies and their IR teams should ultimately embrace economic profit (EP) measures that balance the tradeoffs between other common measures. Indeed, when we added our own cash-based EP measure, Residual Cash Earnings (RCE), to the analysis, it eclipsed all other metrics studied as a driver of value creation.
Five-Tool Playbook for Value Creation
Most companies have too many KPIs and don’t do enough to understand how they relate to one another, and to overall value creation. Through extensive capital market research and collaboration with clients, Fortuna refined a short list of metrics that, together, reliably and comprehensively explain value creation. We refer to these metrics as the Five Tools of Value Creation. IR teams can view this playbook as a way to understand and articulate the levers of their financial strategies and goals to investors.
Figure 1 – Five Tools of Value Creation
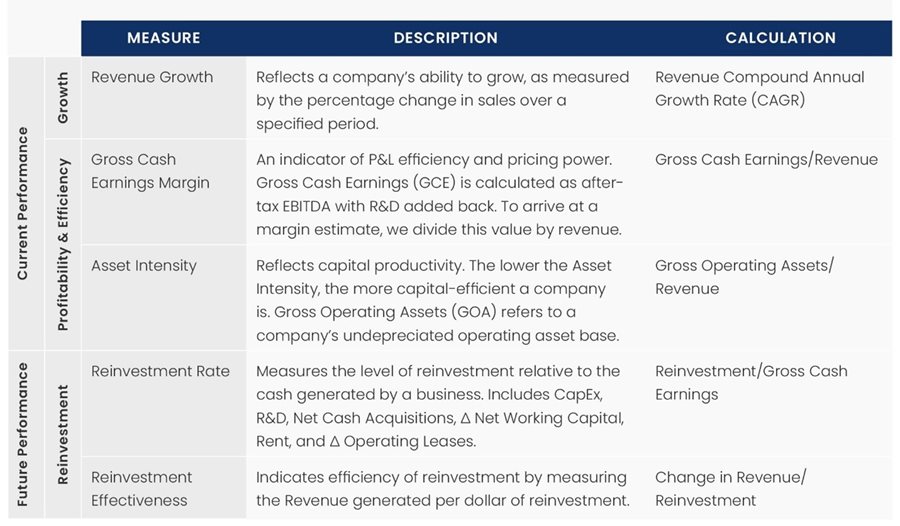
To measure growth, we use a five-year revenue CAGR. For profitability, we use a measure we refer to as Gross Cash Earnings (GCE) Margin. GCE indicates P&L efficiency on a cash basis and typically capitalizes investments in value-creating R&D. Depending on a company’s business model, we may also capitalize inputs like marketing and rent expense. The third tool, Asset Intensity, relates to capital efficiency. With asset intensity, all else being equal, less is more; that is, a low asset intensity would be a sign of capital-productivity.
Our final two measures relate to investment and include Reinvestment Rate—how much of its Gross Cash Earnings (profit) a company reinvests—and Reinvestment Effectiveness, which tracks the revenue growth per dollar of investment. As noted above, Reinvestment Effectiveness was developed to measure how well a company invests its resources.
Trends in Value Creation
To identify the characteristics of top-quartile performers from 2016 through 2020, we measured the Total Shareholder Return performance of the non-financial members of the Russel 1000. We then looked at companies that performed in the top quartile in each of the five measures and calculated their TSR quartile distribution to understand the likelihood of landing in each TSR quartile, given top quartile performance in any of the five measures. We then compared the likelihood of top-quartile vs. bottom-quartile TSR, calculated as a multiple, to determine a relative ranking of each measure’s contribution to TSR.
Figure 2 – Russell 1000 Through the Five-Tool Lens
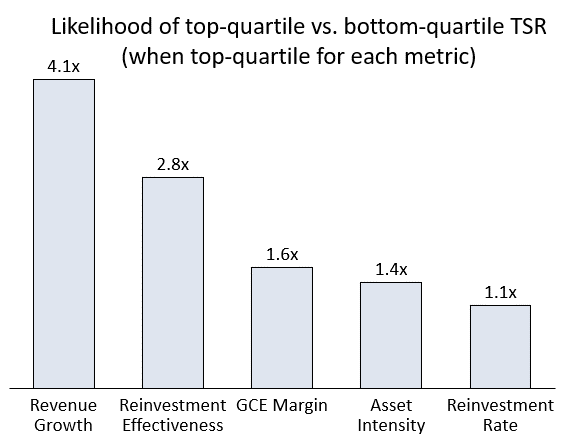
These results show us that a company that achieved top-quartile Revenue Growth was over four times more likely to fall in the top quartile (55%) in terms of TSR than the bottom quartile (13%). So we can infer that Revenue Growth is a more distinguishable characteristic of strong TSR performance than, say, Asset Intensity or Reinvestment Rate.
Revenue Growth
Unsurprisingly Revenue Growth topped the list. While Revenue Growth is a perennial performer for investors, this cycle’s outperformance was perhaps buoyed by the past year (2020) when forward-looking growth took center stage in capital markets, and innovative companies like Tesla, Amazon, and Nvidia led the way to all-time highs across indices.
For great companies that are already reasonably profitable, revenue growth tends to be the best way to add value—and goes a long way to making them great stocks. But for companies that have yet to show adequate profitability, investors tend to be less rewarding of “growth for growth’s sake,” since each dollar of incremental revenue yields less value. So while Revenue Growth alone is not exactly a panacea or “north star” for companies to focus on, it’s clear that investors value it highly under the right conditions.
Reinvestment Effectiveness
Our Reinvestment Effectiveness measure came in second. We believe this was, in part, fueled by increasing rates of disruption and industry turnover, and the heightened need for managements of large, diversified companies to continually assess where their best future returns exist across their portfolios and differentiate allocations accordingly. In other words, it speaks to the increased importance of strategic, and continued, resource allocation efforts by the C-suite.
Profitability (GCE Margin)
In third place, finally, was our measure of profitability. This was a bit of a surprise, given investors’ historical affinity for profit measures like EBITDA, as noted above. This underscores the notion that it’s not enough to be large, profitable, and cost-efficient—companies that want to reach top-quartile TSR need to chart a path to expand over time.
Asset Intensity
Fourth place went to Asset Intensity. We encourage taking this result with a bit more nuance than our other metrics since results varied depending on profitability. In some cases, particular among high-growth companies that were rapidly scaling investment in operations and innovation, high Asset Intensity (normally a bad thing) actually related to stronger market value creation.
Reinvestment Rate
Last was Reinvestment Rate—investing aggressively alone didn’t cut it for investors. Those that want to be rewarded by the market should take a differentiated approach to the allocation of their resources. While this result is not shocking, many of today’s great companies could stand to take a harder look at where they should concentrate their investment. For many, that’s likely the largest obstacle to also being a great stock.
Overcoming Obstacles to Value Creation
Establishing a Reliable Economic Map of the Portfolio
For many large, diversified companies, the biggest barrier to value creation is often a simple lack of visibility into the differentiated value opportunities that exist across different business lines, segments, geographics, etc. It’s hard work but generating a reliable value map across these segments can pay huge dividends by enabling a more strategic approach to capital allocations… which brings us to the next topic.
Inertia of Allocations
As suggested above, the inertia of preexisting allocations can significantly dampen growth and thus market performance. Research by McKinsey & Company showed that one third of business units in their sample received virtually the same allocation as the prior year, and that businesses that were more active in their allocations (top third), achieved, on average, 30% higher total return to shareholders (than those in the bottom third).
The reality is that market and industry turnover have reached a faster pace than ever, and is only accelerating. This leaves many large, public companies at a disadvantage relative to nimbler corporate structures like Private Equity and Venture Capital backed organizations. Despite this, getting capital allocations right has a massive ROI, and companies that commit to strategic resource allocation processes tend to pay off in a big way for investors. For these reasons, we believe our Reinvestment Effectiveness measure can be used to help investors and managements determine how efficiently a company allocates its resources.
Better Measures of Value Creation
While we pinpoint Revenue Growth and Reinvestment Effectiveness as having the largest influence on TSR over the last five years, it is a common mistake to focus singularly on metrics that aren’t comprehensive indicators of value creation. For example, looking at Revenue Growth only tells you part of the story, as we don’t know how much capital was needed to achieve this growth. On the other end, ROIC tells you how efficient your operations were at converting capital to profit, but doesn’t speak to overall growth, or the magnitude of that profit. So managing to maximize either of these measures in isolation invites gaming of the system, and, inevitability, leads to suboptimal value creation—especially for large, diversified public companies.
For this reason, we believe management teams should focus more on cash-based Economic Profit (EP) measures, which are becoming increasingly popular with proxy advisory firms and investors due to their ability to balance growth, returns, and virtually all other value-driving metrics. In other words, economic profit measures are much better proxies for value creation than measures tied to incentives at most public companies.
After extensive work with Economic Value Added (EVA), currently the most-well-known EP measure, Fortuna’s team developed a new version of economic profit that we call Residual Cash Earnings (RCE). RCE is simpler to use for management teams than EVA and doesn’t discourage investment due to its nuanced treatment of depreciation (which invites “sweating of assets”). In addition, Fortuna’s research has also shown that change in RCE relates to TSR better than EVA in every single industry.
Figure 3 – Change in RCE is a Proxy for Value Creation
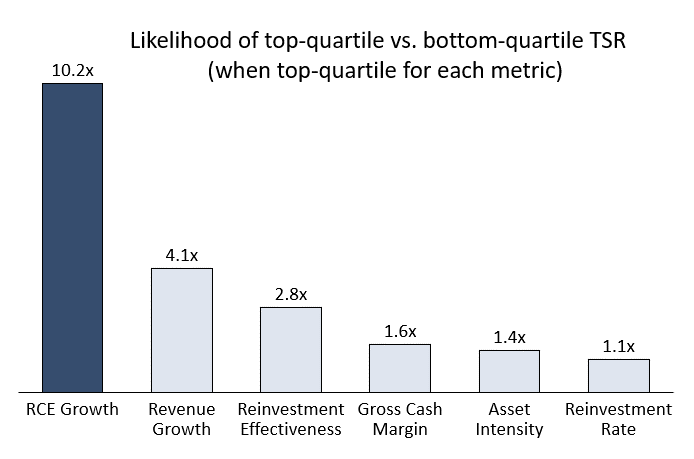
Note: We use the change in RCE divided by Gross Operating Assets—an adjusted measure of undepreciated operating assets—to reflect value creation normalized by size.
Therefore, one might also expect that relatively higher levels of EP measures like RCE would be a distinguishing trait of top-quartile TSR companies. To test this hypothesis, we ran the same quartile analysis from the above section, but this time included change in RCE. The result showed that RCE dwarfed each of the individual Five Tools of Value Creation metrics in terms of its ability to distinguish top- vs. bottom-quartile companies. Companies that achieved top-quartile RCE Growth had a 61% likelihood of top-quartile TSR, versus a 6% likelihood of bottom-quartile TSR! We believe this is intuitive since RCE is effectively a composite of each of the Five Tools. This also suggests that comprehensive measures like RCE can help investors and management teams better evaluate company performance.
Communicating Financial Strategy and Goals
The way IR teams communicate their strategies to investors determines what types of investors they will draw. We hope these insights help investors, boards, and executives understand how their portfolios create value over time, and how they can be pushed to continuously improve—and by doing so attract the investors they deserve. By understanding how different metrics contribute to value creation, teams can use this information to show their commitment to long-term value creation and to communicate their financial goals and strategies to achieve this.
Chris Moore is a Vice President at Fortuna Advisors LLC. Michael Chew an associate at Fortuna Advisors LLC.