Unfortunately, many corporate strategies and decisions are guided by short-term accounting results with inadequate recognition of long-term value drivers. Boards and management teams that seek to be top quartile performers would benefit from taking an updated approach to measuring how they create both intrinsic and market value.
Take the example of Amazon.com and its many detractors. In fealty to traditional accounting metrics, many pundits have claimed the company’s outstanding stock market performance has been an enigma, citing its weak accounting profits and insisting the market has been duped by Jeff Bezos. The truth is that net income and traditional accounting metrics often miss the mark, and there are far better ways to measure value creation.
By using measures designed to reflect how today’s corporations drive long-term value, we can more reliably correlate intrinsic and market value. This is evidenced by the research below, in which we show that the top market value creators are also the top intrinsic value creators. To align these metrics, we just need to use measures that emphasize cash flow and treat investments in innovation and intangibles, which increasingly explain corporate value creation, as… investments—rather than period expenses that drag down current performance.
We also suggest a novel way to more completely measure market value creation. You’re probably familiar with the most commonly used measure of market success, total shareholder return (TSR), and you may be wondering why this would be an inappropriate measure for market value creation. The answer is that it’s incomplete—it indicates quality but not quantity. Said differently, was more value created by Avery Dennison with cumulative five-year TSR through 2019 of 180%, or by Intel with a TSR of 90% over the same period?
Don’t worry, it’s a rhetorical question. We need information about the relative size of the companies to actually answer it, and that’s the point.
A Better Standard of Market Value Creation
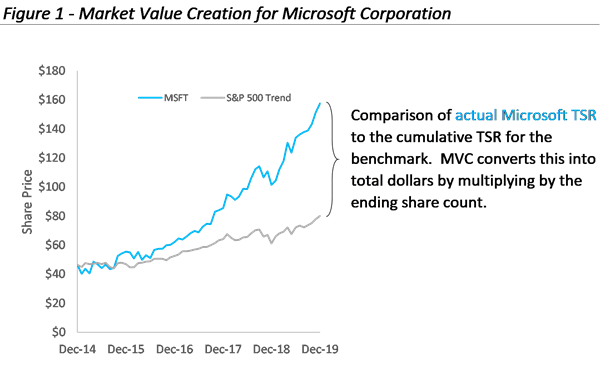
A new measure, Market Value Creation (MVC), was conceived to capture the aggregate market value a company creates, or destroys, for all shareholders, above the broader market return as proxied by the S&P 500. Why is this an improvement on other measures of aggregate market value? The answer is that the dollars of value created in excess of a market return isolates the “excess value,” or total alpha, for which a management team should be credited.
When a company delivers TSR exactly equal to the benchmark, MVC equals zero—no value created or lost. When TSR exceeds the market, MVC is positive, and vice versa. To illustrate this, Figure 2 shows TSR for Microsoft relative to the market benchmark. The gap between its ending share price and what that share price would have been if their TSR were exactly equal to the market benchmark is the value created per share. We multiply this by the number of shares to determine MVC.
Returning to the question above, if all we cared about was the percentage TSR result, Avery Dennison was the clear winner. But if we care about the total relative value created for investors, we must also know the size of these companies. After all, at the end of 2019 the market cap of Intel was over $260 billion, almost 24 times that of Avery Dennison.
MVC Calculation Details
As a proxy for our S&P 500 performance benchmark, we use the “SPY” exchange traded fund, which tracks the index. As opposed to the raw index, the SPY is an investable product that incorporates dividends, as we do for individual companies when determining TSR.
Effectively we start by determining the ending “adjusted share price” that delivers TSR equal to the benchmark. Then we multiply the difference between the actual ending share price and this “adjusted share price” by the number of shares outstanding. The result, measured in dollars, captures both TSR and size –quality and quantity—to indicate the dollars of wealth created for all investors. Figure 2 shows these calculations for Intel and Avery Dennison.

On line A of Figure 2, we see that Avery Dennison delivered double the TSR of Intel. What’s more, their excess TSR relative to the SPY ETF is over six times that of Intel, as shown on line C. This is an important finding, and Avery Dennison was undoubtedly a great performer for their shareholders over the period. But this analysis is incomplete. To incorporate the element of size into the equation, we determine an adjusted ending share price, which would have delivered exactly the TSR of the SPY benchmark.
As shown on line E, this is simply the Actual Ending Share Price on line D, divided by one plus the excess TSR on line C. On line F we see that Avery Dennison delivered over nine times the value creation above the benchmark per share. This is impressive, and individual shareholders holding an equally-weighted portfolio of both companies would have been much happier with Avery Dennison’s performance.
But line G shows that Intel had over 50 times the number of shares outstanding at the end of the five years. By multiplying the excess share appreciation (line F) by the ending share count (line G), we arrive at MVC. Through this analysis, we can determine that Intel created over five times the dollars of Market Value Creation relative to Avery Dennison.
2020 Market Value Creation Leaders
Which companies performed the best on this new MVC measure of market value creation over the five years through 2019? As shown in Figure 3, there are really no surprises. These five companies increased their market capitalization by $2.3 trillion more than if they had all performed exactly at the market benchmark, and this is 3.4 times the total of $675 billion for the next five ranked companies.

To illustrate the importance of size, on average, these five companies delivered TSR that would rank only 39th among the S&P 500 companies. But to rank that high given the huge starting market capitalizations is truly remarkable and MVC captures this very important size dimension.
Although MVC is an ideal measure of success, it’s not great for selecting strategies, developing plans, or making operating decisions, given market variabilities. So in the next section we explore a way to measure intrinsic value using a practical method that aligns with MVC, but can be directly applied to managerial decision-making.
Intrinsic Value Creation and Performance Measurement
I spent over a decade with Stern Stewart implementing economic value added (EVA) at over 100 companies. Following this, I spent almost five years at Credit Suisse applying HOLT’s cash flow return on investment (CFROI) framework to advise scores of corporate leaders on the valuation implications of various transactions. In different ways, these two frameworks aimed to combine drivers of growth, profitability, and capital productivity in order to measure performance in a way that could be reliably related to valuation and share price performance. Unfortunately, both of these measurement frameworks are very complex, which makes them difficult to implement as the focal point of business management.
In 2009 my colleagues at Fortuna Advisors and I embarked on extensive capital market research to improve upon EVA, which was the status quo in corporate value-based performance measurement (CFROI was mostly used by investors, who are also more equipped to handle analytical complexity). The result was Residual Cash Earnings (RCE), which was introduced in an article titled “Postmodern Corporate Finance” published in the Journal of Applied Corporate Finance in 2010. We have implemented RCE for many companies since then, customizing the measure for different businesses and industries.
The biggest difference between RCE and EVA is that RCE is simpler, less volatile, and doesn’t charge for depreciation. And because the capital charge is based on gross undepreciated assets, it doesn’t decline over time, which can cause adverse incentives to “sweat assets.” The cost of owning a new asset is lower at the outset, since there is no depreciation charge, but stays flat even after the asset is fully depreciated. As a result, RCE turns positive sooner after new investments are made, and doesn’t spike artificially as the book value of assets depreciate away. The end result is that, with RCE, there is more incentive to invest and to replace depleting assets—all while maintaining accountability for earning a return over time.
Another important difference is that RCE capitalizes R&D as an investment, with a customizable useful life—which is typically five years in our standard model. Just like property, plant, and equipment, we do not amortize the capitalized R&D, another important difference from EVA. So there is a smooth charge over the lifespan of the “innovation asset.” We can do the same with other investments that are expensed against the P&L like brand-building marketing expenditures, training expenses, etc.—it comes down to identifying what expenditures drive value for a particular business. This leads to more willingness to make these P&L investments, because they are paid for gradually over time; but managers remain accountable for decisions over a much longer period of time since the capital is charged against performance for five years. If an innovation project doesn’t pay off, RCE will decline, creating a powerful incentive to cut ineffective innovation programs when the results don’t seem promising and to reallocate the resources to better opportunities.
Last year I published “Beyond EVA,” which showed that changes in RCE, as a percentage of beginning gross operating assets, relate to TSR better in every industry than similarly calculated changes in EVA. These are important findings, but with our new MVC measure of market success, the linkage to RCE is even stronger.
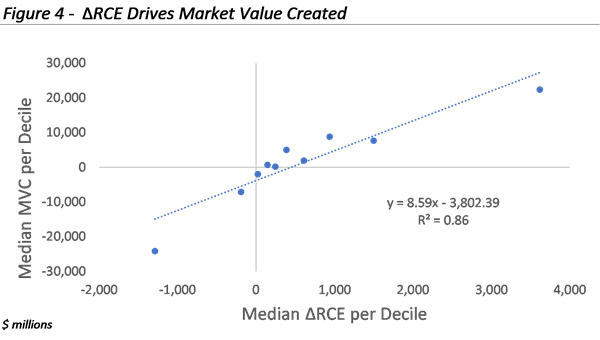
To prepare the analysis represented in figure 4, we started with the 382 non-financial members of the S&P 500 that had full data for the five-year period. We then ranked them from top to bottom based on the change in RCE and split them into deciles with one tenth of the sample in each group. Each dot in Figure 4 represents the median MVC vs the median change in RCE for the 38 companies in the decile. This technique allows us to see the underlying relationship without some of the scatter that exists with individual companies. Figure 4 shows a powerful relationship between MVC and the change in RCE. In other words, companies that grow their cash earnings in excess of the capital charge on new investments drive RCE higher and create intrinsic value.
The slope of 8.59x implies that each dollar of improvement in RCE is worth, on average, $8.59 of incremental MVC. This slope varies considerably by industry due to differences in the investor perceptions of risk and the resilience of RCE. To be sure, intrinsic value can conceptually be better determined based on valuation methods such as discounted cash flow or discounted RCE, but this requires a forecast—and of course everyone has different expectations and forecasts. The change in RCE is a purely objective measure of intrinsic value creation, so it is suitable for measuring performance and driving executive compensation.
For individual companies, MVC can run ahead of the change in RCE when investors are pricing in expectations that are not yet backed by the results. And MVC can trail the change in RCE when performance is expected to decline, perhaps because a brand has lost some of its differentiation, a technology is being replaced, or investors have simply lost faith in management.
2020 Intrinsic Value Creation Leaders

Which companies created the most intrinsic value over the last five years? Measured as the change in RCE (ΔRCE), the number one intrinsic value creator was the very same Amazon.com that led in market value creation (MVC). Experts often say investors are irrational when it comes to Amazon, and perhaps its share price has preceded its intrinsic value at times. Nevertheless, Amazon created the most intrinsic value in terms of RCE improvement over the five years studied; and, predictably, this led to superlative relative market value creation.
Beyond Amazon, the same five companies that lead on our market value creation measure, MVC, also lead our intrinsic value creation ranking—albeit appearing in a different order. These five companies delivered improvement in RCE that was 3.8 times the improvement delivered by companies six through 10, which is higher than the relationship we saw in market value creation (3.4 times). So their advantage on intrinsic value creation over the next five companies is a little stronger than their advantage in market value creation.
RCE as a Centerpiece for Business Management
The value of modern business models, like those employed by Amazon.com, is well explained by the RCE companies produce. This makes it an ideal tool for comparing and aggregating the value creation across corporate business portfolios. It doesn’t matter if a business has significant investments that are expensed, like Amazon, or if it is high or low on growth, profitability, or capital intensity. In all cases, RCE shows if value is created or not.
This is particularly important now as many companies wrestle with strategic resource allocation decisions as they maintain traditional businesses in different stages of digital evolution, while simultaneously launching fully digital businesses. Traditional accounting metrics tend to lead to underinvestment in the new businesses, for the same reasons people say Amazon is unprofitable. Imagine if Walmart, Target, and others had been using a measure that properly measured ongoing profitability in e-commerce? I suspect Amazon would be finding the competition tougher.
To effectively understand and cultivate sources of value in modern corporations, complete measures like RCE should inform how companies set aspirational goals, select strategies, develop plans and budgets, approve investments, measure performance, and, importantly, determine executive compensation. While this discussion and research may seem theoretical to some, the concept has been proven repeatedly in practice. Take the example of Varian Medical Systems.
In August of 2020, Varian announced it had agreed to be acquired by Siemens Healthineers for $16.4 billion, at $177.5 per share, implying an increase in enterprise value of $6.7 billion and almost a doubling of share price within three years—since the official start of its “Varian Value Added” incentives in October 2017. In the same timeframe, the company quadrupled its compounded revenue growth rate from 2.5% to 10.9%, achieved substantial market share gains, and showed increasing productivity from its R&D efforts, including a potentially breakthrough therapy. Most important, it was able to reach over one million more cancer patients.
The right measure can make all the difference, and not just for shareholders.
Greg Milano is founder and CEO of Fortuna Advisors and the author of the book Curing Corporate Short-Termism: Future Growth vs Current Earnings.